★★★★★ 4.9 rating based on 500+ reviews

Claude for Excel — Procurement Tactics
Procurement Tactics · Claude for Excel

Claude for Excel — AI That Actually Understands Your Spreadsheets

8 ready-to-use prompts that turn Claude's Excel add-in into a procurement powerhouse. From spend analysis to supplier scorecards — structured prompts, real results, zero formatting battles.

For Procurement Professionals Who Want AI That Works Inside Their Spreadsheets

Most procurement teams already live in Excel. Spend cubes, supplier scorecards, bid comparisons, contract trackers, budget models. The spreadsheet is where procurement work happens. The problem with AI tools so far has been the disconnect. You copy data out of Excel, paste it into a chat window, lose the structure, and get a generic summary back.

Claude for Excel changes that. It sits inside your spreadsheet as a sidebar, reads your entire workbook (every tab, every formula, every dependency) and works with your actual data in place. Ask it to analyse your spend, and it cites specific cells. Ask it to build a comparison, and it creates it in your workbook. Ask it to fix a broken formula chain, and it traces the logic across tabs.

These 8 prompts are designed specifically for procurement professionals using Claude for Excel. Each one follows a structured prompt engineering framework covering role definition, objective, constraints, and output format. Unstructured prompts produce unstructured results. The structure is what makes the difference between a generic AI answer and a procurement-grade analysis.

Every prompt includes [BRACKETED] fields for you to customise to your specific situation. Copy the prompt, fill in the brackets, paste it into the Claude sidebar in Excel, and let it work with the data that is already open in front of you.

What Makes Claude for Excel Different

Claude for Excel reads your entire workbook, not just the cell you are pointing at. It understands nested formulas, multi-tab dependencies, named ranges, and pivot table structures. When it explains something, it cites specific cells. When it modifies something, it preserves all formula dependencies and highlights every change.

You can set permanent Instructions in the sidebar covering your role, your company, your preferred output format, and procurement terminology. This persists across all conversations. You can also use Skills, which are saved prompts that run as one-click actions, so your entire team can run the same analysis with consistent methodology.

It works with Excel 2016+ on Windows, Mac, and Excel on the web. Installation takes five minutes.

How to Get Started

Install the add-in, sign in, open your procurement spreadsheet, and paste a prompt from below into the Claude sidebar.

Requirements

  • Claude Pro subscription ($20/month) or higher
  • Excel 2016+ (Windows, Mac, or Web)
  • Claude for Excel add-in installed
Step 01

Get the Add-in

Go to the Microsoft Marketplace listing for Claude for Excel. Click 'Get it now.'

Step 02

Activate in Excel

Open Excel. Go to Home → Add-ins (Windows) or Tools → Add-ins (Mac). Find 'Claude by Anthropic' and activate it.

Step 03

Sign In & Configure

Sign in with your Claude account in the sidebar. Set your Instructions: tell Claude your role, company, and preferred output style.

Step 04

Use a Prompt

Open your procurement spreadsheet. Copy a prompt below, fill in the [BRACKETED] fields, and paste it into the Claude sidebar.

The 8 Procurement Prompts for Claude in Excel

Each prompt is structured with role definition, objective, constraints, and output format. Fill in the [BRACKETED] fields to customise each prompt to your situation, then paste it directly into the Claude sidebar in Excel.

About Document Inputs

Each prompt card shows a Document Inputs label listing the data Claude needs to run the analysis. You do not need to upload or attach anything separately. Just open the relevant spreadsheet in Excel before using the prompt. Claude for Excel reads your open workbook automatically, so whatever data is listed under Document Inputs should already be in your Excel file when you paste the prompt.

Prompt 01
Spend Analysis & Category Breakdown
Time saved: 2–4 hours Spend data analysis Category breakdown output
Use Case

You have a spend export open in Excel — from SAP, Coupa, Oracle, or even a manually maintained tracker. You need to understand the distribution: who you are spending with, where the concentration is, and where the maverick spend sits. This prompt asks Claude to analyse the data that is already open in your workbook.

Document Inputs
Spend data (AP export, PO data, or spend cube)
═══ ROLE ═══ You are a senior spend analyst with expertise in procurement spend classification, Pareto analysis, and maverick spend identification. ═══ OBJECTIVE ═══ Analyse the spend data in this workbook. Identify the total spend, top suppliers by value and transaction count, spend distribution by [CATEGORY / COST CENTRE / BUSINESS UNIT], and any transactions with suppliers that are not on the approved supplier list in [TAB NAME / "N/A if no approved list is available"]. ═══ CONTEXTUAL DETAILS ═══ - The spend data is on the tab called [TAB NAME] - Columns include: [DESCRIBE — e.g., "Supplier Name in column B, PO Value in column F, Cost Centre in column D, Date in column A"] - Time period covered: [e.g., "January 2025 – December 2025"] - Approved supplier list is on tab [TAB NAME] (or "not available — skip maverick spend analysis") - I am particularly interested in: [e.g., "identifying our top 20 suppliers and whether we have concentration risk," "finding off-contract spend," "breaking down indirect vs direct spend"] ═══ CONSTRAINTS & ASSUMPTIONS ═══ - Work only with the data in this workbook — do not estimate or assume values - Flag any data quality issues you find (blanks, duplicates, inconsistent supplier names that may be the same entity) - Cite specific cells and ranges in your analysis - If supplier names appear inconsistent (e.g., "Acme Corp" and "ACME Corporation"), flag them as likely duplicates ═══ OUTPUT FORMAT ═══ Create a new tab called "Spend Analysis" with: 1. Summary table: total spend, supplier count, transaction count, average PO value 2. Top 20 suppliers by spend (with % of total) 3. Spend by [CATEGORY / COST CENTRE] (with % of total) 4. Pareto chart data (cumulative % of spend by supplier rank) 5. Maverick spend flag (transactions with non-approved suppliers, if list provided) 6. Data quality issues log ═══ ABOUT ME ═══ I am a [PROCUREMENT ROLE — e.g., "Category Manager" / "Head of Procurement"] at [COMPANY TYPE]. I manage approximately [SPEND VOLUME] in annual procurement spend across [SCOPE — e.g., "indirect categories" / "all categories"]. This analysis will be used to [PURPOSE — e.g., "build a category strategy" / "prepare a savings business case" / "brief leadership on spend distribution"]. ═══ AUDIENCE ═══ Primary: My procurement team who will use this to prioritise categories. Secondary: Finance, who will want to validate the numbers and methodology. The analysis must be traceable to source data in this workbook. ═══ DO'S ═══ Use Pareto analysis to show spend concentration — 80/20 is the starting point. Flag data quality issues prominently — bad data leads to bad strategy. Identify quick wins (obvious consolidation opportunities) separately from strategic opportunities. Cite specific cells, rows, and tab references for every finding. ═══ DON'TS ═══ Do not present generic procurement advice — every finding must reference this specific data. Do not ignore small-value high-frequency transactions — they often signal process problems. Do not average across categories when the distribution is heavily skewed. Do not combine suppliers that look similar but may be distinct legal entities — flag them for me to confirm. ═══ CLARIFYING QUESTIONS ═══ Before producing any output, ask me 5 targeted follow-up questions. Choose questions that surface information you cannot infer from the data in this workbook alone — information that will meaningfully change what you produce. Do not begin the analysis until I have answered. ═══ TONE ═══ Analytical and precise. Cite cells. Flag anomalies clearly. ═══ LENGTH ═══ Full analysis. Summary table concise. Detailed breakdowns comprehensive. Estimated output: new tab with 5–8 structured tables plus commentary.
Prompt 02
Supplier Bid Comparison Matrix
Time saved: 3–5 hours Multi-tab comparison Scorecard output
Use Case

You have received quotes from multiple suppliers — each on a separate tab or in separate columns. You need a normalised comparison across price, payment terms, lead times, and compliance. This prompt asks Claude to read all bid data in the workbook and build a structured comparison matrix.

Document Inputs
Supplier quotes/bids (separate tabs or columns)
═══ ROLE ═══ You are a senior procurement analyst specialising in competitive bid evaluation and total cost of ownership modelling. ═══ OBJECTIVE ═══ Compare the supplier bids in this workbook. Build a normalised comparison matrix across all pricing components, payment terms, delivery terms, SLAs, and any other evaluation criteria present in the data. Calculate a total cost of ownership for each supplier and produce a weighted score if I provide evaluation criteria weights. ═══ CONTEXTUAL DETAILS ═══ - Supplier bids are on tabs: [LIST TAB NAMES — e.g., "Supplier A, Supplier B, Supplier C"] - The RFQ specification or requirements are on tab: [TAB NAME / "not included — compare based on what suppliers have quoted"] - Key comparison dimensions: [e.g., "unit price, tooling costs, MOQ, lead time, payment terms, warranty period, delivery terms"] - Evaluation weights: [e.g., "Price 40%, Quality 25%, Delivery 20%, Commercial Terms 15%" / "use equal weights"] - Currency: [e.g., "all in EUR" / "mixed currencies — convert to EUR using rates on tab X"] ═══ CONSTRAINTS & ASSUMPTIONS ═══ - Normalise pricing to a common basis (same quantity, same period, same currency) before comparing - Flag any line items where a supplier has not quoted or has quoted with exceptions - Do not fill gaps — mark them as "Not Quoted" or "Exception" - Cite the source cells for every data point in the comparison ═══ OUTPUT FORMAT ═══ Create a new tab called "Bid Comparison" with: 1. Side-by-side pricing comparison table (normalised) 2. Total cost of ownership calculation per supplier (3-year if data allows) 3. Non-price comparison table (terms, SLAs, delivery, warranty) 4. Weighted scoring matrix (if weights provided) 5. Compliance check (items not quoted, exceptions, deviations from spec) 6. Recommendation summary with rationale ═══ ABOUT ME ═══ I am a [PROCUREMENT ROLE] at [COMPANY TYPE]. This bid comparison is for [CATEGORY / PROJECT]. The award decision will be reviewed by [APPROVER — e.g., "CFO" / "Procurement Committee" / "Category Director"]. The total contract value is approximately [AMOUNT] over [DURATION]. ═══ AUDIENCE ═══ Primary: The evaluation team who will scrutinise the methodology. Secondary: Leadership who need a clear recommendation with evidence. The comparison must be defensible and traceable to source cells. ═══ DO'S ═══ Normalise pricing to a common basis before comparing — same quantity, same period, same currency. Flag every gap, exception, and non-standard term. Highlight where one supplier materially outperforms others on a specific dimension. Calculate total cost of ownership, not just unit price. ═══ DON'TS ═══ Do not rank on price alone — total value matters. Do not fill data gaps with assumptions — mark as "Not Quoted." Do not produce a neutral comparison that avoids a recommendation. Do not ignore non-standard payment terms or hidden costs in the fine print. ═══ CLARIFYING QUESTIONS ═══ Before producing any output, ask me 4 targeted follow-up questions. Choose questions that surface information you cannot infer from the bid data in this workbook alone — information that will meaningfully change the comparison. Do not begin the analysis until I have answered. ═══ TONE ═══ Neutral and evidence-based. Present findings, flag gaps, cite cells. Let the data drive the recommendation. ═══ LENGTH ═══ Full comparison. All suppliers included. Recommendation section: concise with clear rationale. Estimated: 3–5 new structured tables plus recommendation summary.
Prompt 03
RFP/RFQ Response Scoring Engine
Time saved: 4–6 hours Multi-response evaluation Committee-ready scoring
Use Case

You have compiled RFP/RFQ responses into a workbook — either as raw data or as a summary you have started building. You need to score each supplier against your evaluation criteria, flag non-compliant responses, and produce output ready for your procurement committee.

Document Inputs
RFP/RFQ response data Evaluation criteria with weights
═══ ROLE ═══ You are a senior procurement analyst specialising in RFP/RFQ evaluation, scoring methodology, and supply risk assessment. ═══ OBJECTIVE ═══ Evaluate the supplier responses to this RFP/RFQ. Apply the evaluation criteria and scoring methodology provided. Score each supplier on each criterion, flag failures against mandatory requirements, and produce a recommendation with audit trail showing how each score was derived. ═══ CONTEXTUAL DETAILS ═══ - RFP/RFQ document or requirements are on tab: [TAB NAME] - Evaluation criteria and weights are on tab: [TAB NAME / "use the following weights: [SPECIFY]"] - Supplier responses are on tabs: [LIST TAB NAMES — e.g., "Supplier A Response, Supplier B Response, Supplier C Response"] - Mandatory requirements (must-haves): [LIST — e.g., "ISO 9001 certification, delivery within 30 days, minimum 3-year warranty"] - Scoring scale: [e.g., "1–5, where 1=Non-Compliant, 5=Exceeds Expectations"] ═══ CONSTRAINTS & ASSUMPTIONS ═══ - Score only what is evidenced in each supplier's response data — do not rely on external reputation - Apply mandatory requirements as pass/fail before applying weighted scoring - For each score assigned, cite the specific section of the supplier response that justifies it - Mark "Not Addressed" separately from "Non-Compliant" — they are different findings - Do not adjust scores to produce a preferred outcome ═══ OUTPUT FORMAT ═══ Create a new tab called "RFP Evaluation" with: 1. Pass/fail matrix on mandatory requirements (all suppliers) 2. Detailed scoring matrix (all criteria, all suppliers, with evidence citations) 3. Weighted score summary per supplier 4. Close-call analysis (where suppliers score within 5 points of each other) 5. Audit trail (for each score, the specific response text that justifies it) 6. Committee recommendation with rationale ═══ ABOUT ME ═══ I am a [PROCUREMENT ROLE] at [COMPANY TYPE]. This evaluation is for [CATEGORY / PROJECT] with an estimated annual value of [AMOUNT]. The award recommendation will be presented to [AUDIENCE — e.g., "procurement committee" / "CFO and COO"]. I need the scoring to be audit-defensible. ═══ AUDIENCE ═══ Primary: Procurement committee who will make the award decision based on this scoring. Secondary: Internal audit who may review the evaluation methodology. The scoring must be objective, evidence-based, and traceable to the response data. ═══ DO'S ═══ Apply pass/fail criteria first and flag failures prominently. Justify every score with a specific reference to the supplier's response data. Use consistent scoring methodology across all respondents. Highlight where scores are close and the differentiating factor is narrow. ═══ DON'TS ═══ Do not assign high scores based on general reputation — score only what is evidenced in the response data. Do not skip criteria for any supplier — the evaluation trail must be complete. Do not adjust scores to produce a preferred outcome — let the data speak. Do not conflate "not addressed" with "non-compliant" — they are different findings. ═══ CLARIFYING QUESTIONS ═══ Before producing any output, ask me 5 targeted follow-up questions. Choose questions that surface information you cannot infer from the response data in this workbook alone — information that will meaningfully change the scoring. Do not begin the evaluation until I have answered. ═══ TONE ═══ Analytical, objective, and evidence-driven. Present scores with full audit trail. ═══ LENGTH ═══ Full evaluation. Every supplier scored on every criterion. Committee recommendation: concise. Estimated: 4–6 structured tables plus narrative summary.
Prompt 04
Contract Tracker & Renewal Pipeline
Time saved: 3–5 hours Contract data extraction Renewal calendar output
Use Case

You maintain a contract tracker in Excel — or you should but it is incomplete. You need Claude to read through your contract data, fill gaps, calculate renewal deadlines, flag auto-renewal notice periods, and build a 12-month renewal pipeline you can actually manage from.

Document Inputs
Contract tracker or contract summary data
═══ ROLE ═══ You are a senior contract management specialist with expertise in renewal pipeline management, notice period tracking, and contract risk flagging. ═══ OBJECTIVE ═══ Build a contract management tracker from the contract data in this workbook. Track all active supplier contracts by renewal urgency, flag notice periods, identify auto-renewal terms, and produce a month-by-month renewal calendar for the next 12 months. ═══ CONTEXTUAL DETAILS ═══ - Contract data is on the tab called [TAB NAME] - Columns include: [DESCRIBE — e.g., "Supplier Name in column B, Contract End Date in column D, Notice Period in Days in column E, Auto-Renewal Flag in column F"] - Today's date: [DATE] - Critical notice periods: [e.g., "most require 90 days' notice, some require 6 months"] - I need to track [NUMBER] active contracts ═══ CONSTRAINTS & ASSUMPTIONS ═══ - Work only with the contract data in this workbook - Calculate notice deadlines automatically from end dates and notice periods - Flag contracts with missing notice period data as requiring immediate attention - Do not assume a contract is inactive because the end date has passed — it may have auto-renewed - Cite specific cells and contract references throughout ═══ OUTPUT FORMAT ═══ Create a new tab called "Contract Tracker" with: 1. Master contract list (sorted by renewal urgency, not alphabetically) 2. Renewal pipeline (next 12 months, by month, showing notice deadlines) 3. Auto-renewal flagged list (contracts that auto-renew — highest risk for missed notices) 4. Data quality check (missing notice periods, missing end dates, data gaps) 5. Summary statistics (contracts by renewal month, number at risk, data completeness %) 6. Action items (contracts requiring attention this month and next) ═══ ABOUT ME ═══ I am a [PROCUREMENT ROLE] at [COMPANY TYPE]. I am responsible for [NUMBER] active supplier contracts with a total value of approximately [AMOUNT]. This tracker will serve as [PURPOSE — e.g., "my primary contract management tool" / "input for the annual contract audit" / "baseline for a new contract management system implementation"]. ═══ AUDIENCE ═══ Primary: Me and my team who will manage the renewal pipeline week to week. Secondary: Leadership who need a quarterly view of contract risk and renewal decisions. The tracker must be operationally usable — not just a report but a management tool. ═══ DO'S ═══ Calculate all notice deadlines automatically from contract end dates and notice periods. Flag auto-renewal contracts separately — missed notice windows are the most expensive contract management error. Sort by urgency, not alphabetically. Highlight contracts with missing data as action items. ═══ DON'TS ═══ Do not assume a contract is inactive because the end date has passed — it may have auto-renewed. Do not skip contracts with incomplete data — flag them as requiring immediate attention. Do not create a tracker that only works as a snapshot — it needs to be a living document I can update monthly. Do not prioritise by contract value alone — a low-value contract with a missed notice deadline is still urgent. ═══ CLARIFYING QUESTIONS ═══ Before producing any output, ask me 4 targeted follow-up questions. Choose questions that surface information you cannot infer from the contract data in this workbook alone — information that will meaningfully change what you produce. Do not begin the analysis until I have answered. ═══ TONE ═══ Action-oriented and operationally focused. Highlight risk. Cite cell references. ═══ LENGTH ═══ Full tracker. Every contract included. Renewal pipeline: sorted by urgency. Monthly calendar: 12 months forward. Summary statistics: concise.
Prompt 05
Savings Tracker & Value Reporting
Time saved: 2–4 hours Savings data analysis CFO-ready reporting
Use Case

You track procurement savings in a spreadsheet — hard savings, cost avoidance, negotiated improvements. But the numbers need validation, categorisation, and presentation in a format your CFO will accept. This prompt asks Claude to review your savings data, validate the methodology, and build a structured savings report.

Document Inputs
Savings tracker data
═══ ROLE ═══ You are a senior procurement analyst specialising in savings quantification, baseline validation, and financial reporting to the C-suite. ═══ OBJECTIVE ═══ Validate the procurement savings claimed in this workbook. Classify each entry as hard savings, cost avoidance, or value improvement. Flag any entries where the baseline is an estimate rather than a verified price. Produce a summary report suitable for Finance review and C-suite reporting. ═══ CONTEXTUAL DETAILS ═══ - Savings register is on the tab called [TAB NAME] - Columns include: [DESCRIBE — e.g., "Initiative in column A, Baseline Price in column B, Negotiated Price in column C, Savings Amount in column D, Category in column E"] - Reporting period: [DATE RANGE] - Organisation's definition of hard savings: [DEFINITION — e.g., "a measurable reduction in spend versus the prior period or approved budget that shows up on a PO or invoice"] - Target savings for this period: [AMOUNT] ═══ CONSTRAINTS & ASSUMPTIONS ═══ - Validate every calculation: baseline minus negotiated = savings - Flag entries where the baseline is an estimate rather than a verified historical price or budget - Strictly classify savings (hard savings, cost avoidance, value improvement — do not mix) - Separate validated savings from pipeline or projected savings - Cite the source for every baseline (PO, invoice, budget, or estimate) ═══ OUTPUT FORMAT ═══ Create a new tab called "Savings Report" with: 1. Executive summary (headline hard savings, cost avoidance, value improvement — separately) 2. Validated register (every entry, with baseline source and classification) 3. Savings by category (with breakdown of hard vs avoidance vs improvement) 4. Savings by supplier (showing concentration) 5. Entries requiring validation (flagged individually with reason) 6. Management narrative (150–200 words, suitable for Finance or CEO review) ═══ ABOUT ME ═══ I am a [PROCUREMENT ROLE] at [COMPANY TYPE]. I report procurement savings to [AUDIENCE — e.g., "the CFO" / "the board" / "group procurement"]. My organisation defines hard savings as [DEFINITION — e.g., "a measurable reduction in spend versus the prior period or approved budget that shows up on a PO or invoice"]. This reporting period covers [PERIOD]. ═══ AUDIENCE ═══ Primary: Finance / CFO who will challenge the savings methodology and numbers. Secondary: Procurement leadership who need to track team performance. Every number must withstand financial scrutiny — procurement credibility depends on it. ═══ DO'S ═══ Validate every calculation (baseline minus negotiated = savings) and flag discrepancies. Classify savings strictly: hard savings, cost avoidance, value improvement. Flag entries where the baseline is an estimate rather than a verified price. Separate validated savings from pipeline or projected savings. ═══ DON'TS ═══ Do not combine hard savings and cost avoidance into a single headline number — your CFO will challenge this immediately. Do not include savings where the baseline cannot be verified — flag them for additional validation. Do not inflate totals — conservative, defensible numbers build more credibility than optimistic ones. Do not use procurement jargon in the executive summary — speak the language of finance. ═══ CLARIFYING QUESTIONS ═══ Before producing any output, ask me 4 targeted follow-up questions. Choose questions that surface information you cannot infer from the savings data in this workbook alone — information that will meaningfully change the report. Do not begin the analysis until I have answered. ═══ TONE ═══ Conservative, credible, finance-focused. Every number is defensible. ═══ LENGTH ═══ Full validated register. Executive summary: 3–4 rows maximum. Category and supplier breakdowns: comprehensive. Entries requiring validation: flagged individually.
Prompt 06
Supplier Performance Scorecard
Time saved: 3–5 hours Multi-KPI synthesis QBR-ready scorecard
Use Case

You have supplier performance data scattered across tabs or columns — delivery rates, quality metrics, invoice accuracy, response times. You need Claude to synthesise it into a structured scorecard with RAG ratings, trend analysis, and a QBR agenda.

Document Inputs
Delivery, quality, invoice, and SLA data
═══ ROLE ═══ You are a senior supplier relationship manager specialising in performance data analysis, SLA verification, and quarterly business review preparation. ═══ OBJECTIVE ═══ Build a performance scorecard for [SUPPLIER NAME] using the data in this workbook. Track delivery performance, quality metrics, SLA compliance, commercial terms adherence, and any other performance data available. Highlight trends, flag SLA breaches, and produce a structured agenda for the next quarterly business review. ═══ CONTEXTUAL DETAILS ═══ - Performance data is on the following tabs: [LIST TAB NAMES — e.g., "Deliveries, Quality, Invoices, SLAs"] - Key metrics and SLAs: [DESCRIBE — e.g., "On-time delivery target 95%, defect rate <2%, invoice accuracy >99%"] - Reporting period: [DATE RANGE] - Last QBR date: [DATE] - Next QBR is scheduled for [DATE] ═══ CONSTRAINTS & ASSUMPTIONS ═══ - Show performance by period (monthly/quarterly), not just averages — trends matter more - Cross-check data sources if multiple tabs provide overlapping data — use the more conservative reading - Flag SLA breaches specifically: date, metric, actual vs target, severity - Do not produce a soft scorecard that avoids honest assessment — performance reviews that soften the message create weak supplier relationships - Cite specific cells and data sources for every metric ═══ OUTPUT FORMAT ═══ Create a new tab called "Supplier Scorecard [SUPPLIER NAME]" with: 1. Performance dashboard (all key metrics, current period vs prior period) 2. Trend analysis (last 6–12 months of data, showing trajectory) 3. SLA breach log (every breach, with date, metric, actual vs target, severity) 4. Commercial performance (on-time invoicing, payment term compliance, etc.) 5. Strengths and opportunities (explicit recognition of strong performance + areas for improvement) 6. QBR agenda (structured, maximum 1 page, with discussion points and data to reference) ═══ ABOUT ME ═══ I am a [PROCUREMENT ROLE] responsible for the relationship with [SUPPLIER NAME]. The next quarterly business review is scheduled for [DATE]. The outcome of this review will affect [IMPACT — e.g., "contract renewal decision" / "supplier tier classification" / "improvement plan trigger"]. My QBR will be attended by [ATTENDEES — e.g., "our operations director and their account director"]. ═══ AUDIENCE ═══ Primary: My internal team preparing for the QBR — they need data that is credible and defensible. Secondary: The supplier, who will receive the scorecard and may challenge the data. Every figure must be traceable to source data in this workbook. ═══ DO'S ═══ Show performance by period (monthly/quarterly), not just averages — trends matter more. Cross-check data sources if multiple tabs provide overlapping data — use the more conservative reading. Flag SLA breaches specifically: date, metric, actual vs target, severity. Recognise strong performance explicitly — QBRs that only focus on failures damage relationships. ═══ DON'TS ═══ Do not produce a green dashboard if the data shows red — performance reviews that soften the message create weak supplier relationships. Do not average around data gaps — flag missing months explicitly. Do not conflate one-off incidents with systematic failure — the distinction matters for the discussion. Do not produce a scorecard the supplier can factually challenge — every figure must be traceable. ═══ CLARIFYING QUESTIONS ═══ Before producing any output, ask me 5 targeted follow-up questions. Choose questions that surface information you cannot infer from the performance data in this workbook alone — information that will meaningfully change the scorecard. Do not begin the analysis until I have answered. ═══ TONE ═══ Data-driven, balanced, and relationship-focused. Honest about performance without being punitive. ═══ LENGTH ═══ Full scorecard. Dashboard table: complete across all periods. SLA breach log: every breach. QBR agenda: concise and structured — maximum 1 page equivalent.
Prompt 07
Should-Cost Model Builder
Time saved: 4–6 hours Cost breakdown analysis Negotiation-ready model
Use Case

You are preparing for a supplier negotiation and need to understand what the product or service should cost based on its components. You have some cost data — raw material prices, labour rates, overhead estimates — but need Claude to structure it into a should-cost model you can use at the negotiation table.

Document Inputs
Cost component data Market prices Supplier quotes
═══ ROLE ═══ You are a senior procurement cost analyst specialising in bottom-up cost modelling, margin analysis, and negotiation preparation. ═══ OBJECTIVE ═══ Build a bottom-up should-cost model for [PRODUCT / SERVICE]. Start with component costs and labour, not with the supplier's price. Calculate the implied supplier margin. Produce sensitivity analysis to show how the model changes if key cost inputs shift. This model will be used to benchmark the current quoted price and prepare for negotiation. ═══ CONTEXTUAL DETAILS ═══ - Current supplier quote: [AMOUNT] for [QUANTITY / SCOPE / PERIOD] - The quote is dated: [DATE] - Specification or scope of work: [DESCRIBE — or "attach as tab"] - Available cost benchmarks: [e.g., "raw material indices on Tab X, labour rates on Tab Y, market comparables on Tab Z"] - Negotiation date: [DATE] ═══ CONSTRAINTS & ASSUMPTIONS ═══ - Build the model bottom-up from component costs — do not simply decompose the supplier's price - Clearly label every assumption and distinguish known costs from estimates - Calculate sensitivity ranges — what happens if key inputs shift by ±10–20% - Present the implied supplier margin as a range, not a single number - Flag cost elements where data is unavailable — do not guess ═══ OUTPUT FORMAT ═══ Create a new tab called "Should-Cost Model" with: 1. Bill of materials or scope breakdown (quantity, unit cost, extended cost) 2. Labour and overhead allocation 3. Cost of goods sold calculation 4. Sensitivity analysis (key variables ±10–20%, showing impact on total cost) 5. Implied margin analysis (supplier's quoted price minus should-cost) 6. Negotiation talking points (concise, 3–5 key leverage points based on the model) ═══ ABOUT ME ═══ I am a [PROCUREMENT ROLE] at [COMPANY TYPE]. I am preparing for a negotiation with [SUPPLIER NAME] for [PRODUCT / SERVICE]. The current quoted price is [AMOUNT] and I need to understand whether this is fair. The negotiation is scheduled for [DATE / TIMEFRAME]. This model will be used to [PURPOSE — e.g., "challenge the supplier's pricing" / "benchmark against market rates" / "build an internal cost estimate"]. ═══ AUDIENCE ═══ Primary: My negotiation team who will use this model as a reference during discussions. Secondary: My line manager who needs to approve the target price before the negotiation. The model must be specific enough to use at the table but honest about its limitations. ═══ DO'S ═══ Build the model bottom-up from component costs — do not simply decompose the supplier's price. Clearly label every assumption and distinguish known costs from estimates. Calculate sensitivity ranges — what happens if key inputs shift by ±10–20%. Present the implied supplier margin as a range, not a single number. ═══ DON'TS ═══ Do not present the should-cost as the "correct" price — it is a negotiation tool with stated confidence levels. Do not ignore cost elements just because you don't have data — flag them as gaps. Do not build a model so complex it cannot be explained at the negotiation table. Do not assume the supplier's margin is excessive without evidence — some cost structures legitimately require higher margins. ═══ CLARIFYING QUESTIONS ═══ Before producing any output, ask me 5 targeted follow-up questions. Choose questions that surface information you cannot infer from the cost data in this workbook alone — information that will meaningfully change the model. Do not begin the analysis until I have answered. ═══ TONE ═══ Analytical and transparent about assumptions. Confidence levels clearly stated. ═══ LENGTH ═══ Full model. Cost breakdown table: comprehensive. Sensitivity analysis: key variables only. Negotiation talking points: concise. Estimated: 3–4 structured tables plus commentary.
Prompt 08
Budget vs Actuals Variance Analysis
Time saved: 2–3 hours Financial variance analysis Management reporting
Use Case

You have procurement budget data and actual spend data in your workbook. Month-end is approaching and you need to explain the variances — what went over, what came under, why, and what it means for the forecast. This prompt asks Claude to do the variance analysis and build management-ready commentary.

Document Inputs
Budget data Actuals data
═══ ROLE ═══ You are a senior financial analyst specialising in budget variance analysis, spend forecasting, and operational reporting to finance leadership. ═══ OBJECTIVE ═══ Perform a variance analysis of budgeted vs actual procurement spend. Classify variances into: timing differences, genuine savings, cost overruns, and one-off items. Highlight material variances only. Project the year-end position based on current run-rate. Produce a management narrative suitable for Finance review. ═══ CONTEXTUAL DETAILS ═══ - Budget data is on the tab called [TAB NAME] - Actuals data is on the tab called [TAB NAME] - Structure: [DESCRIBE — e.g., "by category, by business unit, by cost centre"] - Reporting period: [MONTH / QUARTER] - Materiality threshold: [e.g., ">5% variance" or ">€50K"] - Year-to-date period: [e.g., "January – March 2025"] ═══ CONSTRAINTS & ASSUMPTIONS ═══ - Calculate both absolute and percentage variances - Focus commentary on material variances only — not every line needs explanation - Distinguish between timing differences (non-recurring), genuine savings, and cost overruns (recurring) - Use finance language, not procurement jargon - Project year-end position with clear statement of assumptions ═══ OUTPUT FORMAT ═══ Create a new tab called "Variance Analysis" with: 1. Summary variance table (budget, actual, variance %, top 5 overspend, top 5 underspend) 2. Variance by category (showing material items only) 3. Classification of variances (timing, savings, overrun, one-off) 4. Year-end forecast (based on current run-rate, with assumptions stated) 5. Management narrative (150–200 words, for Finance/CFO review) 6. Action items (what needs to be done to address overruns or capitalise on savings) ═══ ABOUT ME ═══ I am a [PROCUREMENT ROLE] at [COMPANY TYPE]. I report to [REPORTING LINE — e.g., "the CFO" / "the VP Procurement" / "group finance"]. This variance analysis covers [PERIOD] and will be used in [CONTEXT — e.g., "the monthly management review" / "quarterly board reporting" / "year-end financial close"]. My materiality threshold for commentary is [THRESHOLD — e.g., ">5% variance" / ">€50K variance"]. ═══ AUDIENCE ═══ Primary: Finance / CFO who thinks in P&L terms and wants concise, financially precise commentary. Secondary: Procurement leadership who needs to understand what drove the variances and what to do about them. The narrative must speak the language of finance, not procurement. ═══ DO'S ═══ Calculate both absolute and percentage variances. Focus commentary on material variances only — not every line needs explanation. Distinguish between timing differences, genuine savings, one-off items, and cost overruns. Project the year-end position based on current run-rate. ═══ DON'TS ═══ Do not explain every line — focus on what matters. Do not use procurement terminology in the management narrative — write for a finance audience. Do not conflate a timing difference with a cost saving — they are fundamentally different. Do not present the forecast without stating the assumptions behind it. ═══ CLARIFYING QUESTIONS ═══ Before producing any output, ask me 4 targeted follow-up questions. Choose questions that surface information you cannot infer from the budget and actuals data in this workbook alone — information that will meaningfully change the analysis. Do not begin the analysis until I have answered. ═══ TONE ═══ Financially precise, concise, and executive-focused. Assumptions clearly stated. ═══ LENGTH ═══ Full variance analysis. Summary table: concise. Top overspend/underspend: 5 each maximum. Management narrative: 150–200 words. Forecast: one summary table.

Pricing

The pricing below is for Claude, Anthropic's AI platform. These are Anthropic's plans and are not set or managed by Procurement Tactics.

Pro — $20/month

Full Claude for Excel access. Best for individual procurement professionals.

Max — $100/month

Higher usage limits + Claude for PowerPoint. For power users managing high-volume procurement.

Team — Per-seat pricing

Shared Skills across the team. Consistent methodology for everyone.

Enterprise — Custom pricing

SSO, admin controls, organizational deployment. For procurement departments.

All plans include the same Claude intelligence. The difference is usage limits and collaboration features.

AI Fundamentals for procurement

Get Your Procurement Team AI-Ready

Some of your team members already use AI. Others barely started. This program trains AI skills for everyone within 21 days. Many procurement teams are seeing massive results. Are you?

Team-wide AI adoption in 21 days
Built for real procurement tasks

Talk to a procurement AI specialist

Procurement's AI Opportunity is Now

Procurement leaders, you have a clear responsibility: you have to lead the AI transformation. AI is not a hype. It is no longer optional. It is a must-have skill for excelling procurement teams. Equip your team with the skills they need to extract the maximum from AI.

Teams that invest now will gain a strategic advantage, future-proof their operations, and drive real impact value in a fast-changing business landscape.

“If you’re not using this technology, you’re not going to be relevant compared to your peer groups and your competitors… Adopt it, and adopt it fast.”

Eric Schmidt, Former CEO Google

%

of executives say AI adoption is essential to stay competitive

%

expected productivity gains from leveraging AI

For Procurement Teams & Procurement Leaders

Short, intensive programs designed to set procurement teams and leaders up for success in the AI era. Developed and delivered by procurement experts who are leading the adoption of AI; built for procurement, by procurement.

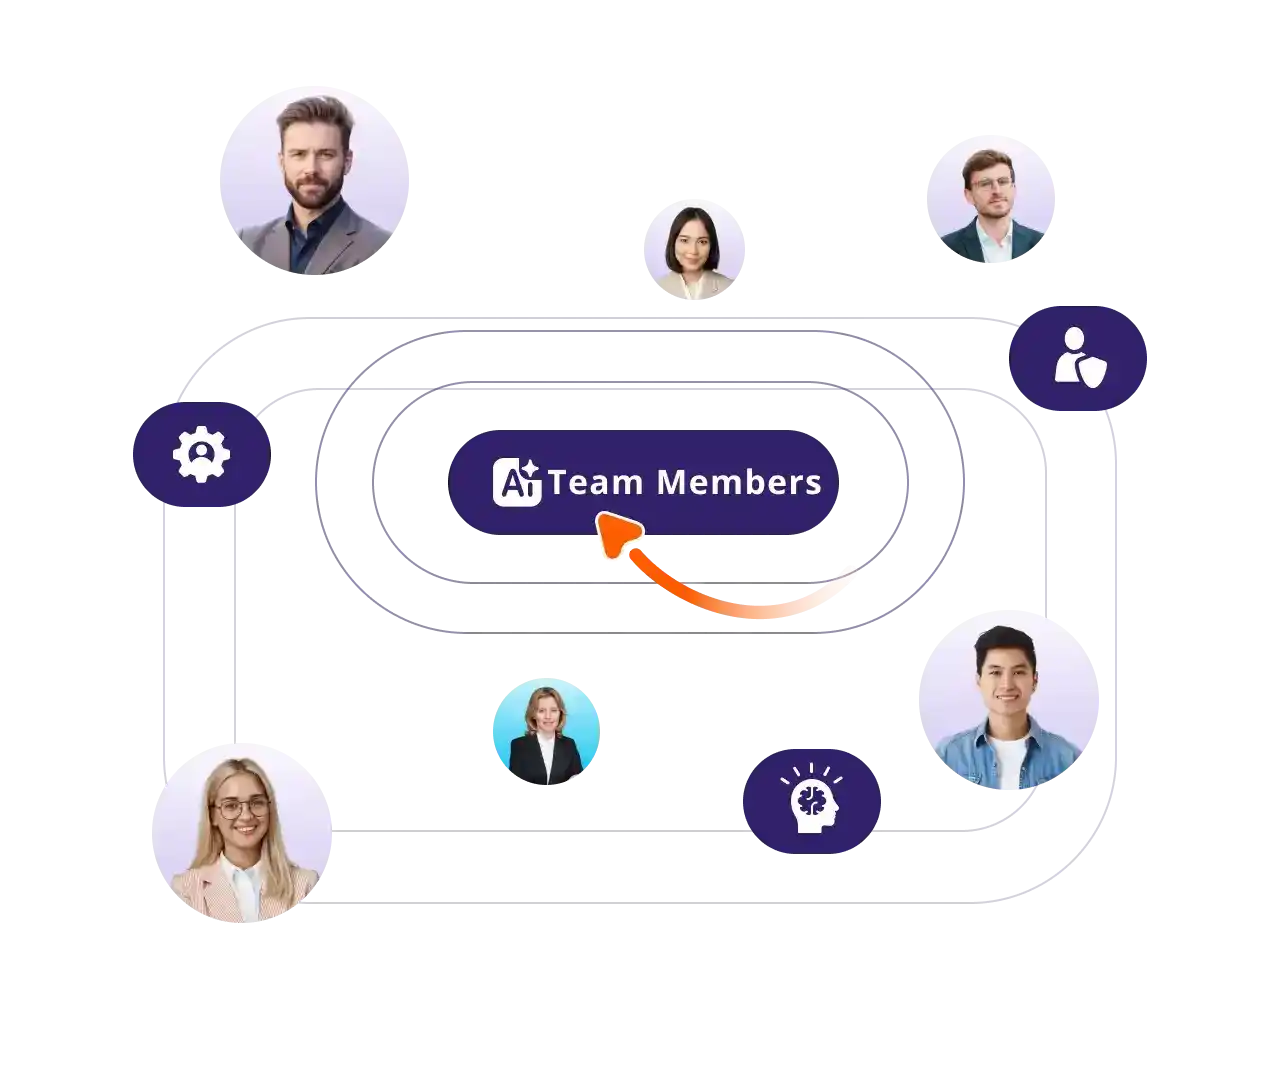
AI Fundamentals For Your Team

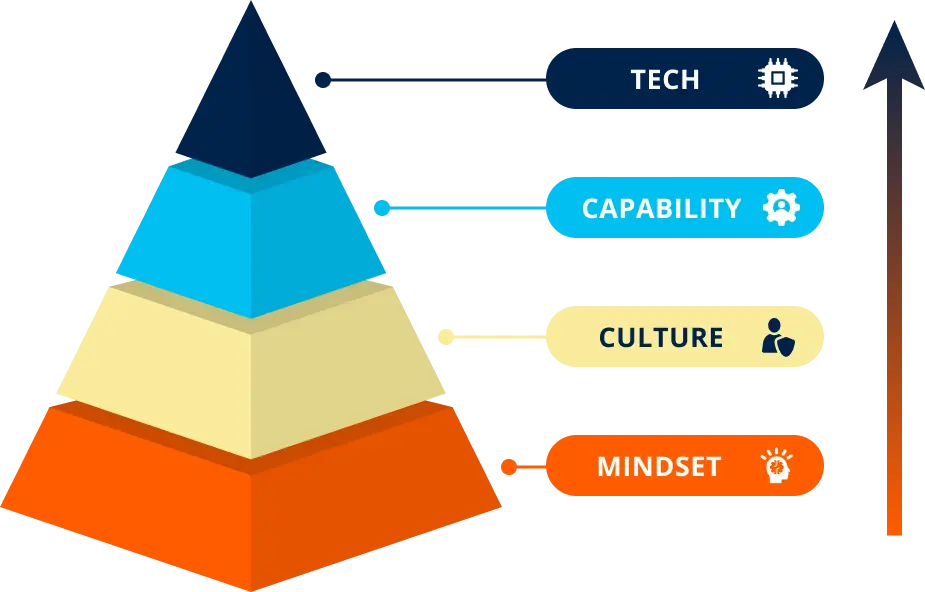
Build the mindset, culture, and capabilities to start unlocking real AI impact, fast!
📚 Immersive Learning
Live expert sessions + self-paced modules for procurement teams.

📅 21-Day Program
Flexible, high-impact AI training tailored to your goals.

🌍 Real Examples
Apply AI to sourcing, contracts, and supplier management.

📈 AI Progress Tracker
Benchmark and measure ROI with clear and accurate metrics.

🤝 Hands-On Projects
Encourage practical use and secure ongoing advancement.

💬 Expert Access
Monthly Q&A with AI and procurement experts to solve your problems.

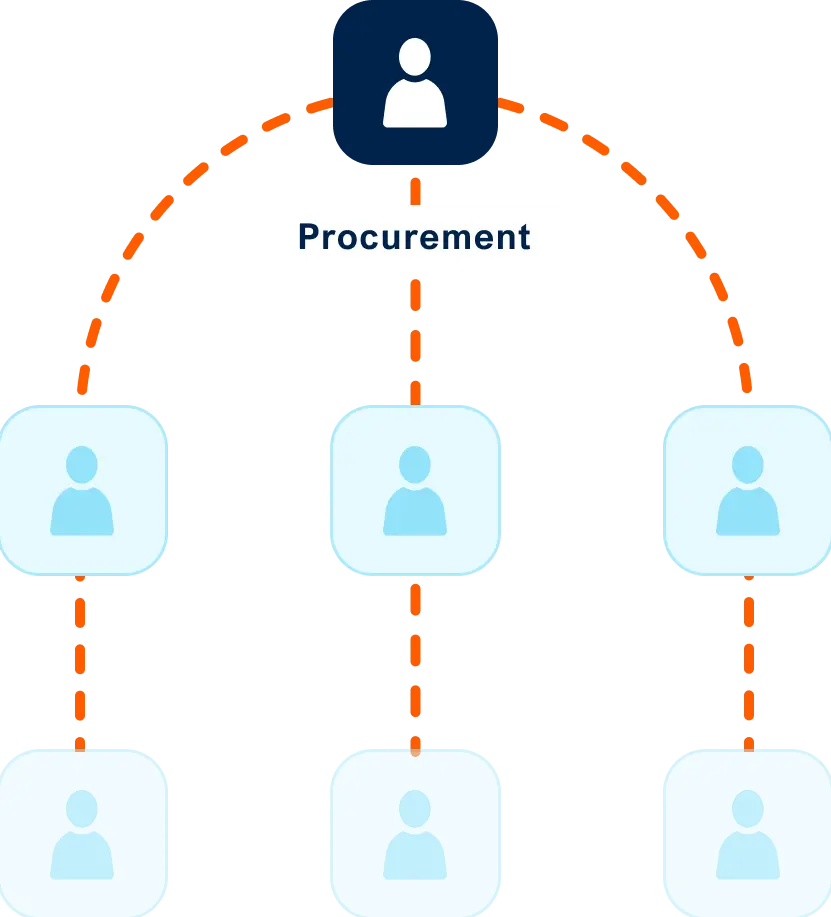
AI Fundamentals For Procurement Leaders

Align your team on an AI vision and build a strategic roadmap for procurement transformation.
📅 21-Day Program
Focused, high-impact training to accelerate AI usage in your team.

🌍 Real Examples
Learn from real examples of procurement leaders leading the AI-way

💬 Expert Access
Monthly Q&A with AI and procurement experts to solve your problems.

🎯 Leaders Aligned
Unify your team with a shared understanding of AI's role in procurement.

📚 Immersive Learning
Live expert sessions + self-paced modules for procurement leaders.

📍 Actionable Roadmap
Leave with a clear plan to implement AI in your procurement process

Succeeding in AI through Talent

Mastering AI isn't about using the newest tool

Winning with AI requires investing in people, not just tools.

We see many people caring too much about using the newest tool, but they are utilizing only 10% of what is possible.

Using the newest tools is great, but actually knowing how to use them is key.

Leading procurement teams adopt a structured approach to change, integrating talent and technology to transform their function into an AI-driven powerhouse.
Program Overview For Your Team

Program Overview For Your Team

Stage 1
Module 1: 10 Things To Know Before Using AI
Team Kickoff
LIVE
Stage 2
Module 2: How AI Works & Why It Matters
Module 3: Prompt Engineering Essentials
Live Q&A
LIVE
Stage 3
Module 4: Applying AI in Procurement
Module 5: Streamlining Procurement Ops
Stage 4
Module 6: Future of AI in Procurement
Procurement Automation With AI Agents
Live Q&A
LIVE
AI Assessment (optional)
Ongoing
Self-paced (mini) Courses
Downloadable Templates
Monthly Expert Q&A
Program Overview

Program Overview for Procurement Leaders

Stage 1
Module 1: Your Role in AI Adoption—Where to Start
Leadership Kickoff
LIVE
Stage 2
Module 2: Creating an AI Policy—Rules for Safe & Effective Use
Module 3: Implementing AI—How to Enable Your Team
Live Q&A
LIVE
Stage 3
Module 4: AI Tools & Building Your Own Solutions
Module 5: Risks & Common Pitfalls (and How to Avoid Them)
Stage 4
Module 6: AI Roadmap—Long-Term Strategy for Procurement Teams
AI Agents for Leaders
Live Q&A
LIVE
AI Assessment (optional)
Ongoing
Self-paced (mini) Courses
Downloadable Templates
Monthly Expert Q&A

Meet your instructors

Marijn Overvest Procurement Tactics

Marijn Overvest

Procurement Thought Leader & AI Expert

Marijn Overvest Procurement Tactics

Ralph De Groot

Senior Learning Consultant & AI Expert

SUPPORT

FAQs

Have more questions? Get in touch with one of our sales consultants. Book a demo for further questions.

How do I enroll my team?

Schedule a demo call with our team. You can book a consultation directly on their calendar or reach out to us at [email protected]. We'll discuss timelines and get your team on board!

How much time does this require?

The leadership program can be finished within 5-6 hours.

The program for your team can also be finished within 5-6 hours.

If you decide to also participate in the optional modules that cover AI agent building, this will take another 5-6 hours.

Need help choosing the right pace? Discuss your team’s goals and timeline with one of our Procurement Learning Specialists in a free discovery call.

Is there a fixed schedule?

No. Your dedicated Procurement Learning Consultant will work with you during onboarding to:

  • Agree on a tailored timeline
  • Lock in dates for the kick-off, live sessions, and graduation/demo day
  • Define progress checkpoints to keep learners on track

Before each live session, participants should complete a set portion of the self-paced modules, ensuring productive, focused discussions.

This structured yet flexible approach keeps teams aligned while accommodating procurement professionals’ busy schedules.

Is there a live learning component?

Yes!

This program comes with a kickoff and a 2 live Q&A sessions to solve your AI problems in procurement.

What type of support can we expect?

During the pre-enrollment process, our procurement specialists will guide your decision-making and address all your questions. You can reach them by email or schedule a quick consultation call whenever needed.

Once enrolled, you'll be assigned a dedicated Procurement Learning Consultant who will:

  • Serve as your single point of contact throughout the program

  • Coordinate all logistics including kickoff, scheduling, and live sessions

  • Onboard your procurement team and handle any program-related needs

  • Work closely with you to maximize the impact on your team's procurement capabilities

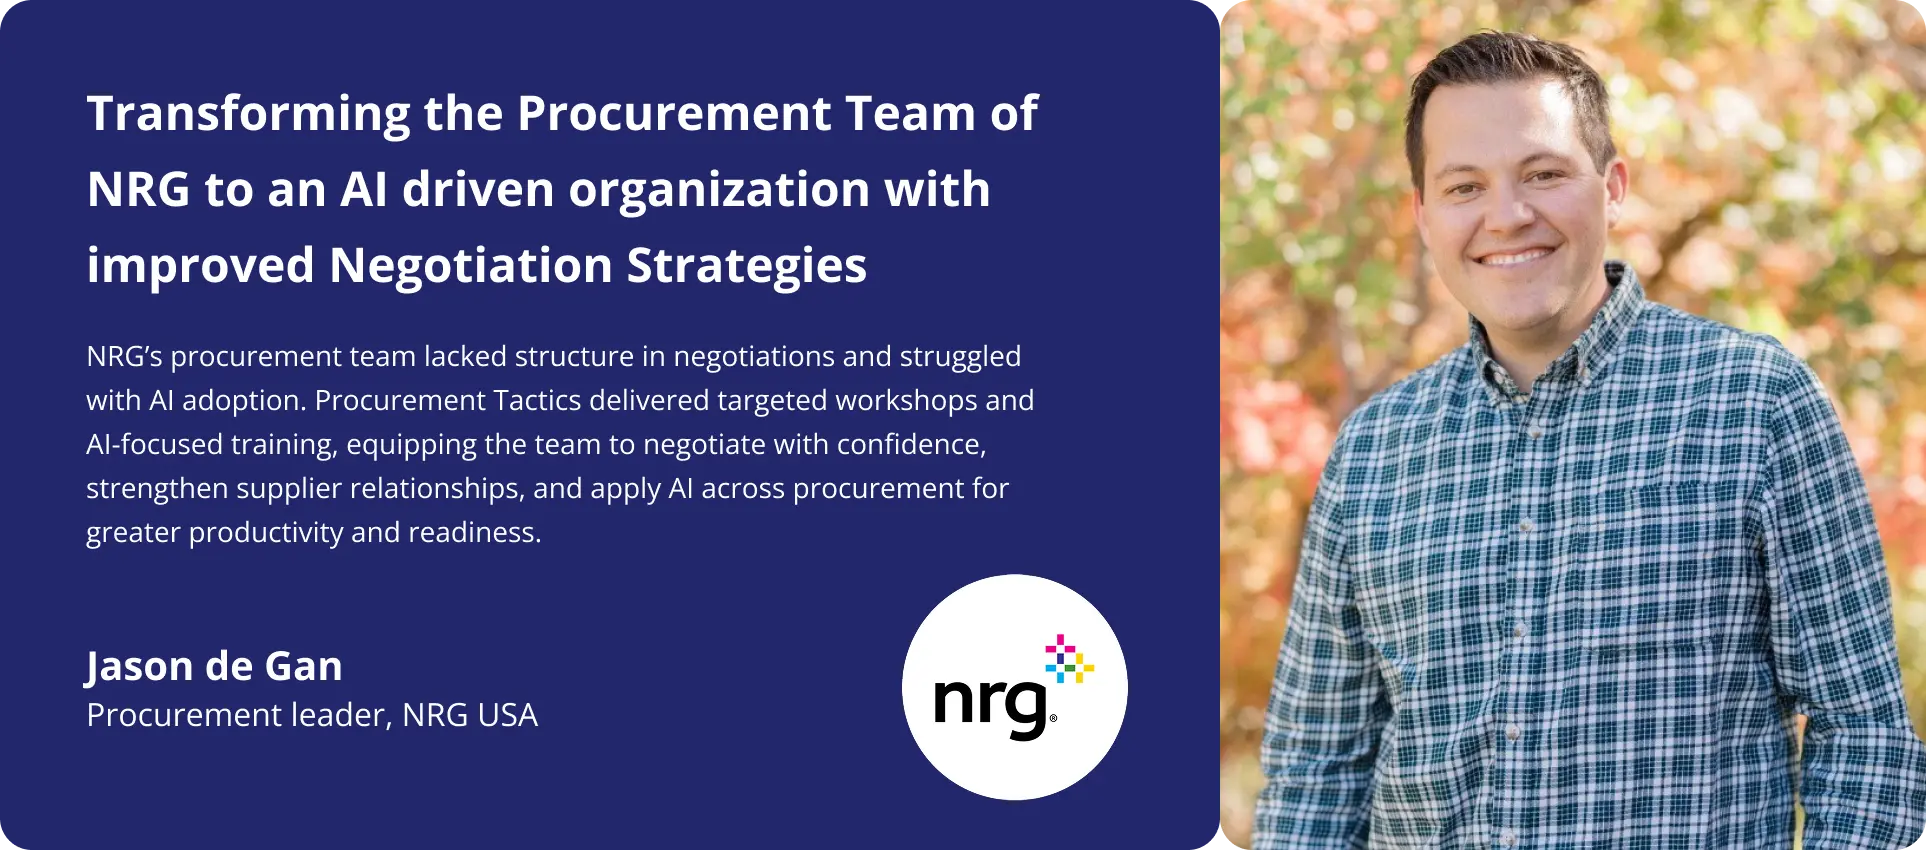
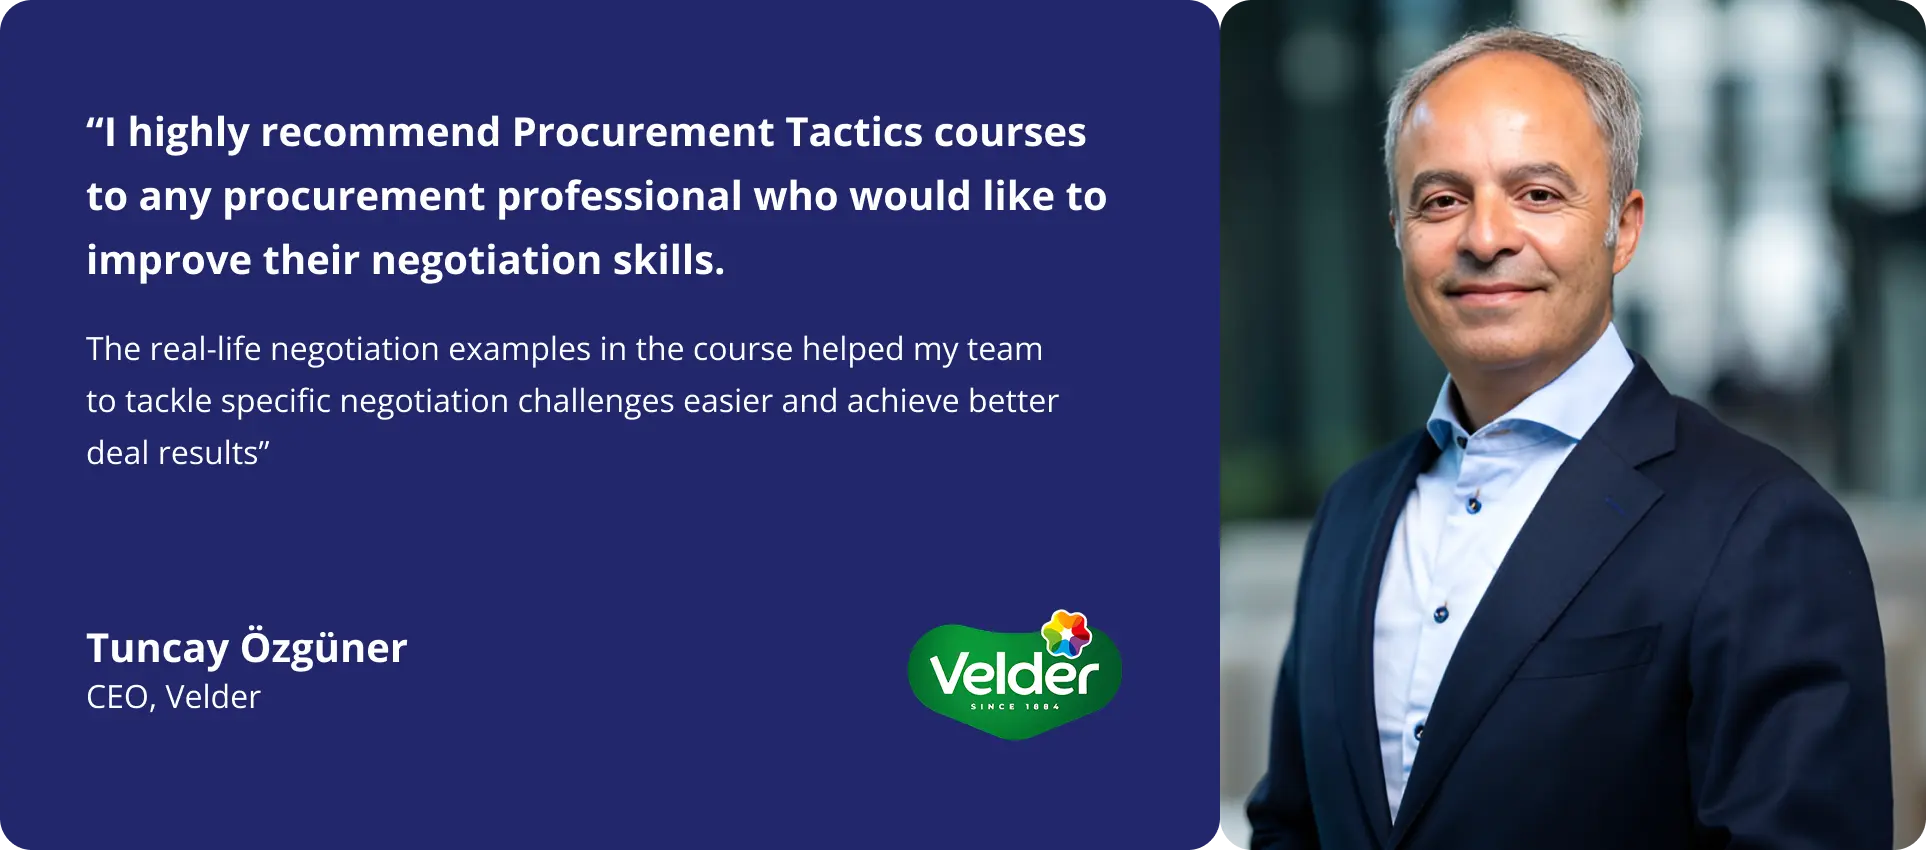
Client Success Stories
Slide 1
Slide 2
Slide 3

NEXT STEP

Program Overview + Price Quote

Ready to upskill your procurement team with critical AI skills?

Request a price quote and the program overview using the form, or reach out to us directly if you'd like to discuss what's right for your team.

Click here to grab a slot in my calendar. Talk soon!


Pim Herremans


Get Price Quote

Get Price Quote