Written by Marijn Overvest | Reviewed by Sjoerd Goedhart | Fact Checked by Ruud Emonds | Our editorial policy
10 Best Spend Analysis Software of 2026

As taught in the Spend Analysis Course / ★★★★★ 4.9 rating
- Spend analysis software consolidates and categorizes purchasing data across invoices, purchase orders, and contracts to give procurement teams clear visibility into spending patterns.
- Spend analysis software leverages AI-driven classification and interactive dashboards to uncover maverick spend and highlight cost-saving opportunities.
- Spend analysis software automates data cleansing and enrichment, enabling finance and procurement to make faster, data-driven sourcing decisions.
What is Spend Analysis Software?
Software for consumption analysis is a procurement solution that consolidates and standardizes data from purchase contracts. Data is collected from invoices and orders for purchase contracts and cost reports in a single database.
With an interactive control panel, predictive analytics, and AI-powered supply, these platforms provide procurement and financial teams with complete visibility into supplier consumption and performance, thereby optimizing sourcing strategies and supporting informed decisions.
Top 10 Spend Analysis Software
1. SAP Ariba Spend Analysis
Built on the SAP HANA in-memory platform, SAP Spend Control Tower unifies spend data from SAP and non-SAP systems into a central repository.
It applies machine-learning classification and market-intelligence enrichment to automatically tag spend by supplier, category, geography, and business unit.
Pre-configured dashboards surface trends in maverick spend, supplier risk, and contract compliance, while ad-hoc reporting lets users drill down to transaction-level detail for investigative analytics.
Deep integration with the broader Ariba procurement suite and SAP ERP ensures end-to-end visibility and seamless data flow, ideal for large enterprises with existing SAP landscapes aiming to reduce procurement cycle times and enforce global sourcing policies.
Real-Life Example of SAP Ariba Spend Analysis in Academia
The King Abdullah University of Science and Technology (KAUST) deployed SAP Ariba Spend Analysis to consolidate procurement data from multiple research centers into a single, unified view.
Within weeks, they gained near real-time visibility into over $200 million of annual spend, enabling them to spot contract leaks and reduce maverick purchases by 18%.
2. Coupa Spend Analysis
Coupa’s AI-driven spend module centralizes direct, indirect, and travel-and-expense data into a unified “spend intelligence” lens.
It employs Coupa AI for automated data classification, outlier detection, and real-time anomaly alerts (e.g., unexpected price spikes or unauthorized vendors).
Rich visualizations and self-service dashboards enable users to benchmark their performance against industry peers through Coupa’s global community data.
Coupa’s broad suite (including P2P, expense, and contract modules) makes it simple to tie spend insights directly to sourcing events and invoice workflows, driving rapid ROI, with customers reporting multimillion-dollar savings within months of deployment.
Real-Life Example of Coupa Spend Analysis in Manufacturing
Jabil, a global manufacturing services provider, rolled out Coupa to bring its $6 billion of indirect spend under control.
By centralizing over 2.9 million purchase orders and applying Coupa AI for automated classification, they achieved 95% spend visibility within months, unlocking process improvements and multi-million-dollar savings.

3. JAGGAER Spend Analytics
Part of the unified JAGGAER One platform, Spend Analytics offers up to 95 % automated classification using configurable taxonomies and AI-powered supplier enrichment.
It normalizes data from ERP, e-procurement, and AP systems, then delivers out-of-the-box dashboards for savings opportunities, tail-spend leakage, and ESG compliance.
Self-service predictive capabilities enable procurement teams to set spend thresholds and receive compliance-risk alerts before signing contracts.
Its networked architecture also facilitates shared-services models, making it a strong choice for global organizations seeking standardized analytics across business units.
Real-Life Example of JAGGAER Spend Analytics in Engineering & Construction
A leading international engineering and construction firm used JAGGAER Spend Analytics to process 1.5 GB of raw spend data (representing $4.5 billion in transactions across 130 sites) in just 20 days.
Drill-down dashboards flagged quality-related supplier issues, cutting supply-chain disruptions by 12 %.
4. GEP SMART Spend Analysis
Natively deployed on Microsoft Azure, GEP SMART’s Spend Analysis module cleanses, validates, and classifies spend data from any source system, using a taxonomy-agnostic engine.
Advanced “opportunity finder” algorithms sift through data to spot consolidation prospects, supplier rationalization angles, and contract renewal flags.
Real-time alerts notify stakeholders when spend thresholds are exceeded, while the forecast workbench projects future spend trends based on historical patterns.
Tight integration with GEP’s sourcing, contract, and savings-tracking modules enables closed-loop governance, well-suited for organizations focused on continuous improvement and proactive cost management.
Real-Life Example of GEP SMART Spend Analysis in Banking
A major U.S. bank with over $80 billion in annual revenue and 5,000 branches implemented GEP SMART to unify spend data from disparate ERPs.
In under three months, they achieved 98 % automated classification, uncovered $50 million in cost-reduction opportunities, and accelerated monthly reporting from weeks to days.
5. Zycus Spend Analysis (iAnalyze)
Zycus iAnalyze leverages agentic AI for end-to-end spend intelligence: automated data profiling, multilingual classification, and tail-spend optimization.
Its Merlin Intake engine ingests disparate data formats, enriching supplier profiles with risk scores (e.g., compliance, ESG) and mapping spend to four category hierarchy levels.
The Automated Savings Opportunity Identifier surfaces hidden cost-reduction projects, from volume-discount negotiations to low-value purchase consolidation.
A drag-and-drop dashboard builder and role-based alerts make it easy for procurement, finance, and compliance teams to collaborate on savings initiatives and risk mitigation, particularly valuable for multinational enterprises with complex supplier networks
Real-Life Example of Zycus iAnalyze Spend Analysis in Airlines
Delta Air Lines partnered with Zycus in May 2024 to transform its procurement analytics. Using iAnalyze’s Agentic AI, Delta ingested multilingual invoice and PO data across global business units, surfacing hidden tail-spend savings.
Within the first quarter, they identified $15 million in consolidation opportunities and reduced off-contract spend by 22 %.
6. Oracle Fusion Cloud Procurement – Spend Analytics
Built on Oracle Cloud Infrastructure, Oracle Fusion Spend Analytics ingests and harmonizes spend data from ERP, e-procurement, and third-party sources into a single “golden record.”
It uses machine-learning algorithms to auto-classify transactions, detect anomalies, and enrich supplier profiles with performance and risk metrics.
Pre-built dashboards visualize spend by category, region, and business unit, while ad-hoc reporting lets teams slice and dice data for deeper investigations.
Embedded predictive insights forecast future spend trends, helping organizations align budgets and sourcing strategies in real time.
Real-Life Example of Oracle Fusion Spend Analytics in Retail
A leading global retailer implemented Oracle Fusion Spend Analytics to consolidate spend across 2,000+ stores and multiple ERP systems.
Within eight weeks, they achieved 97 % automated classification, uncovered $28 million in over-payment errors, and accelerated monthly spend reporting from 15 days to under 3.
7. IBM Emptoris Spend Analysis
Part of the IBM Emptoris suite, this module centralizes direct, indirect, and T&E spend into a unified data lake.
Its taxonomy-agnostic engine cleanses, deduplicates, and auto-classifies transactions with over 90 % accuracy, leveraging natural-language processing to handle complex invoices and contracts. Interactive scorecards track supplier performance, compliance breaches, and tail-spend leakage.
Advanced “what-if” scenario modeling allows teams to simulate contract renegotiations or sourcing shifts and quantify potential savings before execution.
Real-Life Example of IBM Emptoris Spend Analysis in Insurance
A Fortune 100 insurer deployed Emptoris Spend Analysis to unify spend from five disparate ERPs.
In three months, they delivered 92 % spend visibility, flagged $12 million in off-contract purchases, and reduced tail-spend transactions by 20 %.
8. Ivalua Spend & Procurement Analytics
Ivalua’s Spend Analytics sits natively within its end-to-end procurement platform, aggregating spend, contract, and supplier performance data.
Its AI-driven classification engine supports multi-level taxonomy hierarchies and adapts dynamically to new categories. Self-service dashboards and custom KPIs let procurement teams monitor maverick spend, supplier risk, and ESG performance.
The platform’s “opportunity canvas” surfaces consolidation and rationalization projects, while integrated workflow tools guide stakeholders through savings capture and compliance remediation.
Real-Life Example of Ivalua Spend Analytics in Aerospace
An aerospace OEM used Ivalua to merge spend across five business units. Within two months, they achieved 98 % classification accuracy, identified $45 million in strategic sourcing opportunities, and reduced contract cycle times by 30 %.
9. Basware Analytics – Spend & Procurement Insights
Leveraging Basware’s global network and AP-automation backbone, Basware Analytics unifies P2P, invoice, and T&E data for end-to-end spend visibility.
Its taxonomy-flexible engine auto-tags spend by supplier, commodity, and region, while network-wide benchmarks allow users to compare performance against peers. Role-based alerts notify procurement and finance teams of overspend or contract expirations.
Predictive modules project future cash requirements and support dynamic discounting strategies to optimize working capital.
Real-Life Example of Basware Analytics in Pharmaceuticals
A major pharma company adopted Basware Analytics to analyze $15 billion in global spend. By Q2, they increased PO compliance by 25 %, identified $20 million in early-payment discount opportunities, and cut supplier onboarding time by 40 %.
10. Corcentric (Determine) Spend Analytics
Determine’s Spend Analytics offering combines automated data ingestion with configurable classification rules and AI-powered enrichment.
It normalizes spend from ERP, sourcing, and AP systems, then delivers pre-configured dashboards for spend leakage, supplier risk, and regional compliance. Advanced filtering and drill-through capabilities let users pinpoint savings and compliance gaps.
Its closed-loop design integrates back into sourcing and contract management, ensuring that identified opportunities are actioned and tracked to completion.
Real-Life Example of Corcentric Spend Analytics in Automotive
An international automotive OEM rolled out Determine Spend Analytics to consolidate spend across six ERP landscapes.
In four months, they achieved 96 % automated classification, uncovered $32 million in tail-spend consolidation opportunities, and improved contract compliance by 18 %.
How to Choose the Right Solution
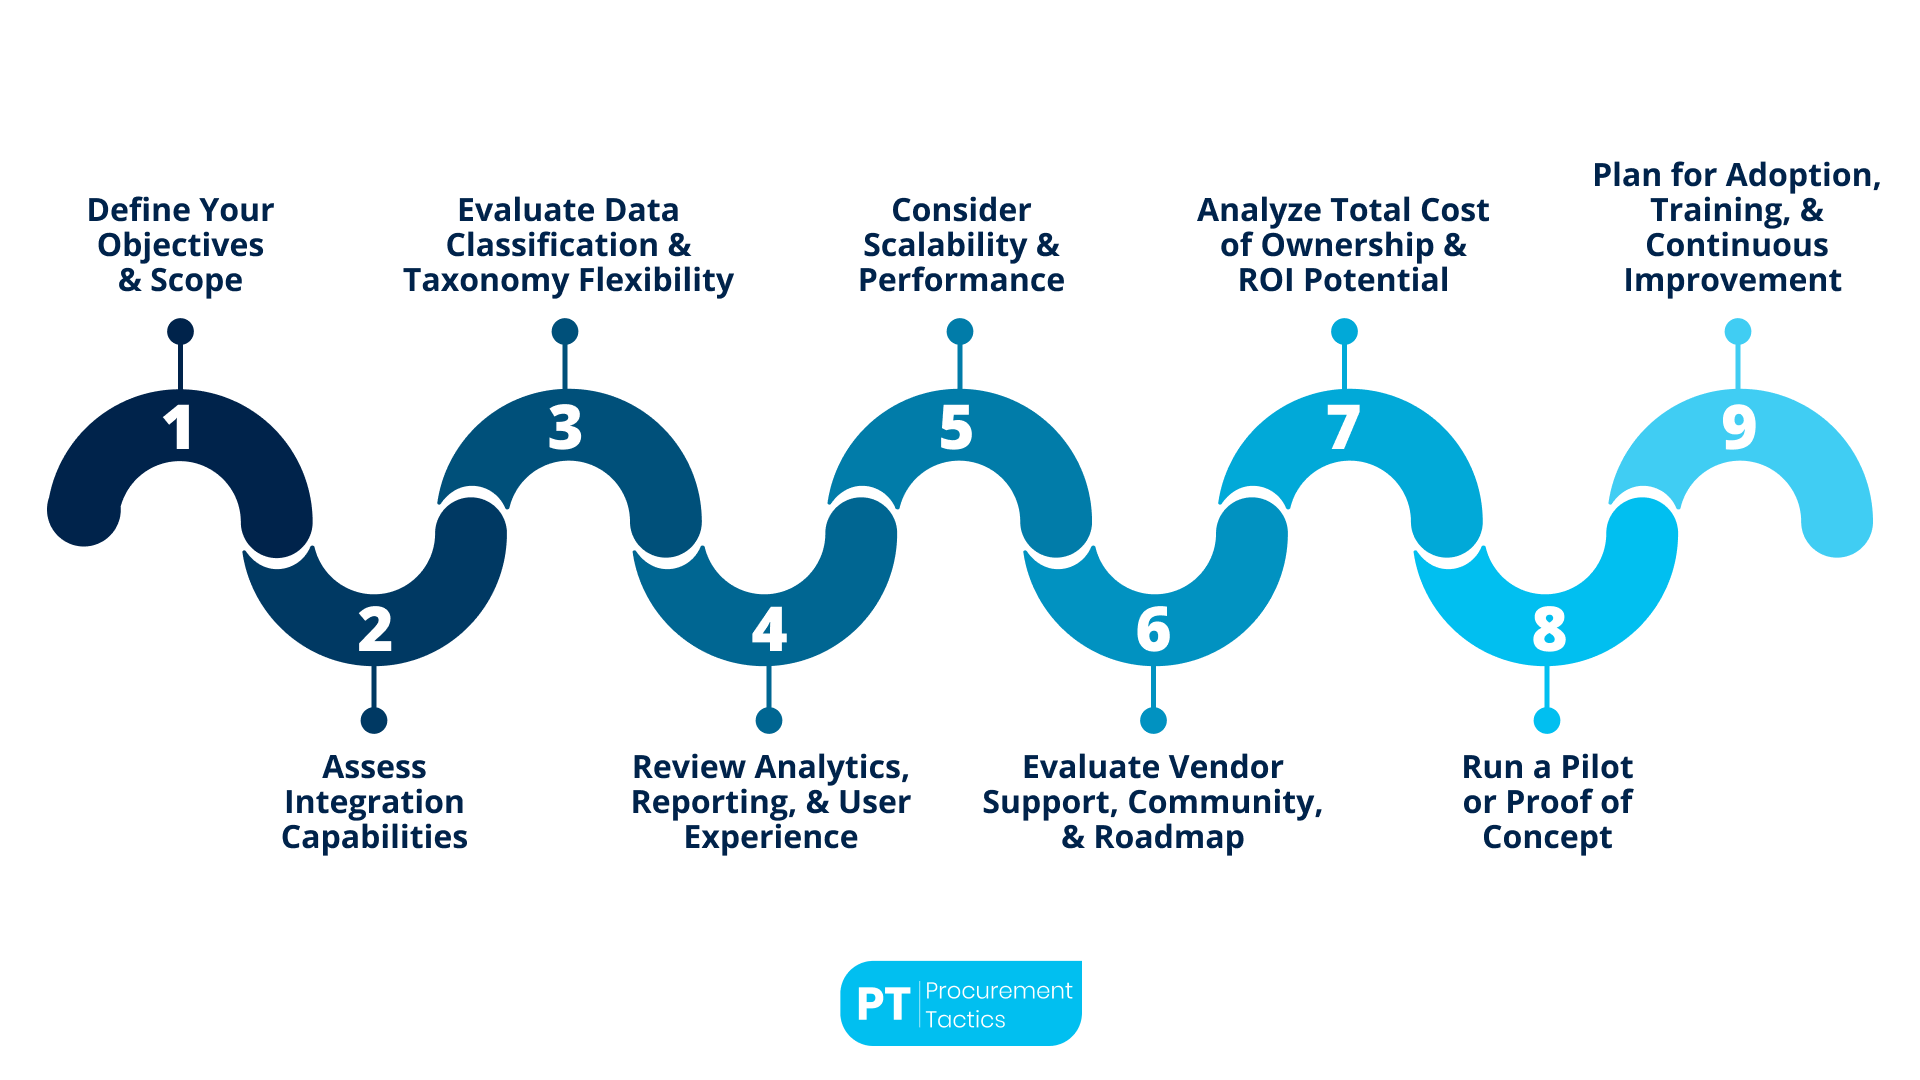
1. Define Your Objectives and Scope
Before evaluating vendors, clarify exactly what you need the software to achieve. Are you primarily focused on indirect spend visibility, tail-spend management, supplier risk monitoring, or full‐lifecycle spend governance?
Determine which data sources (ERP, P2P, T&E, contracts) you want to ingest, and estimate your data volume and refresh frequency needs. This will guide you toward solutions whose core strengths align with your strategic priorities and technical realities.
2. Assess Integration Capabilities
A best‐of‐breed spend-analysis tool is only as good as the data it ingests. Verify that the solution provides pre-built connectors or flexible APIs for your systems, including ERP (e.g., SAP, Oracle), e-procurement, accounts payable, travel and expense, and contract repositories.
Ask for reference integration blueprints and sample mapping templates. The easier it is to automate data flows, the faster you’ll get to “clean,” consolidated spend.
3. Evaluate Data Classification and Taxonomy Flexibility
Automated spend classification is a major time-saver, but taxonomies need to vary by industry and organization. Look for AI or machine‐learning engines that can learn from your existing master data, supplier hierarchies, and category definitions.
Ensure the solution supports custom category hierarchies and can be tuned over time to improve accuracy. Higher automation rates (ideally 80–95 %) reduce the manual effort needed to maintain data quality.
4. Review Analytics, Reporting, and User Experience
Drill‐down reporting, interactive dashboards, and self‐service query tools should be intuitive for both procurement analysts and business stakeholders. Request a hands-on demo with your anonymized data if possible.
Evaluate whether the UI allows easy slicing by supplier, category, business unit, geography, and time. Consider the learning curve: does the vendor offer templated dashboards and guided analytics for common use cases?
5. Consider Scalability and Performance
As your organization grows or your data footprint expands, the platform must scale without significant performance degradation.
Ask about data, processing architecture (in-memory, columnar storage, distributed compute), and average load times for large data sets.
Clarify any limits on data volume, number of users, or concurrent queries, and understand how additional usage will impact licensing and infrastructure costs.
6. Evaluate Vendor Support, Community, and Roadmap
Strong customer success and support are essential, especially during initial implementation and taxonomy tuning. Investigate the vendor’s professional services offerings, typical implementation timelines, and training programs.
Explore user communities, knowledge bases, and peer benchmarking networks; the more active and mature the ecosystem, the faster you can learn best practices and troubleshoot issues.
Finally, review the product roadmap to ensure upcoming features (e.g., advanced AI, real-time alerts) align with your future needs.
7. Analyze Total Cost of Ownership and ROI Potential
Compare not just license fees but also implementation services, integration costs, data-cleansing efforts, and ongoing maintenance.
Build a simple ROI model: estimate savings from improved contract compliance, reduced maverick spend, and time saved on manual classification.
Balance upfront investment against projected annual savings to justify the business case. Transparent pricing models, whether per‐user, per-data-volume, or enterprise‐wide, help avoid surprises.
8. Run a Pilot or Proof of Concept
Whenever possible, pilot the top one or two candidate solutions with a subset of your data and users.
A targeted POC—focusing on a single business unit or spend category—allows you to validate data ingestion, classification accuracy, dashboard insights, and end-user satisfaction.
Use the pilot outcomes to refine your requirements, finalize category mappings, and build momentum for a broader rollout.
9. Plan for Adoption, Training, and Continuous Improvement
Choosing the right software is only half the battle; successful deployment depends on user adoption and ongoing governance.
Establish a cross-functional steering committee, define clear roles for data stewards, and schedule regular “data hygiene” reviews.
Leverage vendor-provided training and “train-the-trainer” programs to build internal expertise. Finally, set up quarterly business reviews with stakeholders to measure performance against your original objectives and identify new opportunities.
Key Benefits of Using Spend Analysis Software
Future Trends in Spend Analysis
Conclusion
In an era where every dollar counts, spend analysis software has become indispensable for organizations striving to gain clarity and control over their procurement outlays. By automatically gathering, cleansing, and categorizing data from invoices, purchase orders, contracts, and expense reports, these platforms deliver a unified view of spending patterns, supplier performance, and compliance risks.
Leading solutions—ranging from SAP Ariba’s deeply integrated Spend Control Tower to Zycus iAnalyze’s agentic AI—demonstrate how enterprises in academia, manufacturing, construction, banking, and aviation can uncover hidden savings, reduce maverick spend, and accelerate reporting timelines.
As procurement teams look ahead, the right spend analysis tool will not only address today’s needs through robust integration, customizable taxonomies, and user-friendly analytics but also evolve with emerging trends such as real-time monitoring, predictive scenario modeling, and embedded AI-driven insights.
A structured selection process (defining objectives, piloting candidates, assessing total cost of ownership) combined with strong governance and continuous improvement ensures that spend analysis transforms from a one-time project into an enduring strategic capability, driving smarter sourcing decisions and sustainable cost management for years to come.
Frequentlyasked questions
What is spend analysis software?
Spend analysis software consolidates and categorizes purchasing data across invoices, purchase orders, and contracts to give procurement teams clear visibility into spending patterns.
What is the most important benefit of using spend analysis software?
The most important benefit of using spend analysis software is enhanced spend visibility that empowers procurement teams to uncover cost-saving opportunities.
What is the most important future trend in spend analysis?
The most important future trend in spend analysis is AI-driven predictive analytics, enabling real-time forecasting and proactive spend optimization.
About the author
My name is Marijn Overvest, I’m the founder of Procurement Tactics. I have a deep passion for procurement, and I’ve upskilled over 200 procurement teams from all over the world. When I’m not working, I love running and cycling.

